
In addition to the written quarterly market summary, we also provide a pre-recorded market summary video. In this video, Ryan Detrick, Chief Market Strategist, from Carson Group shares the key events we saw in the past quarter and how we think they’ll affect markets moving forward.
This video format offers several benefits:
- Can be watched at your convenience, either before or after your scheduled committee meeting
- It provides additional commentary and market insights
- Available for committee members who are unable to attend the meeting
- Archived for future viewing

A Resilient Economy
The bull market officially turned one in October, with stocks up about 20% over the past year. The bull market’s first year is in line to be the worst since 1988, which followed a historic bear market. However, 1989 saw a gain of 29.0%, which was the best second year of a bull market ever. Additionally, out of 15 major bear market lows going back to 1950, the second year after the bear ended was higher every time, with an average gain of 13.5%.
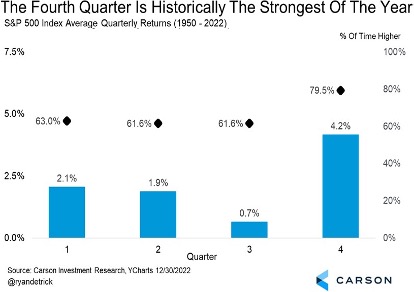
The fourth quarter is typically the best quarter of the year for stocks. The S&P 500 is up nearly 80% of the time and by 4.2% on average, which is twice as strong as the next closest quarter historically, the first, which averages 2.1% growth. The fourth quarter often gains strength by rebounding from third-quarter weakness. This trend has played out so far this year.
It doesn’t get much simpler than this: The U.S. economy relies on consumption, and consumption comes from income. Overall income in the economy is dependent on three factors:
- Employment growth
- Hourly wage growth
- Number of hours worked
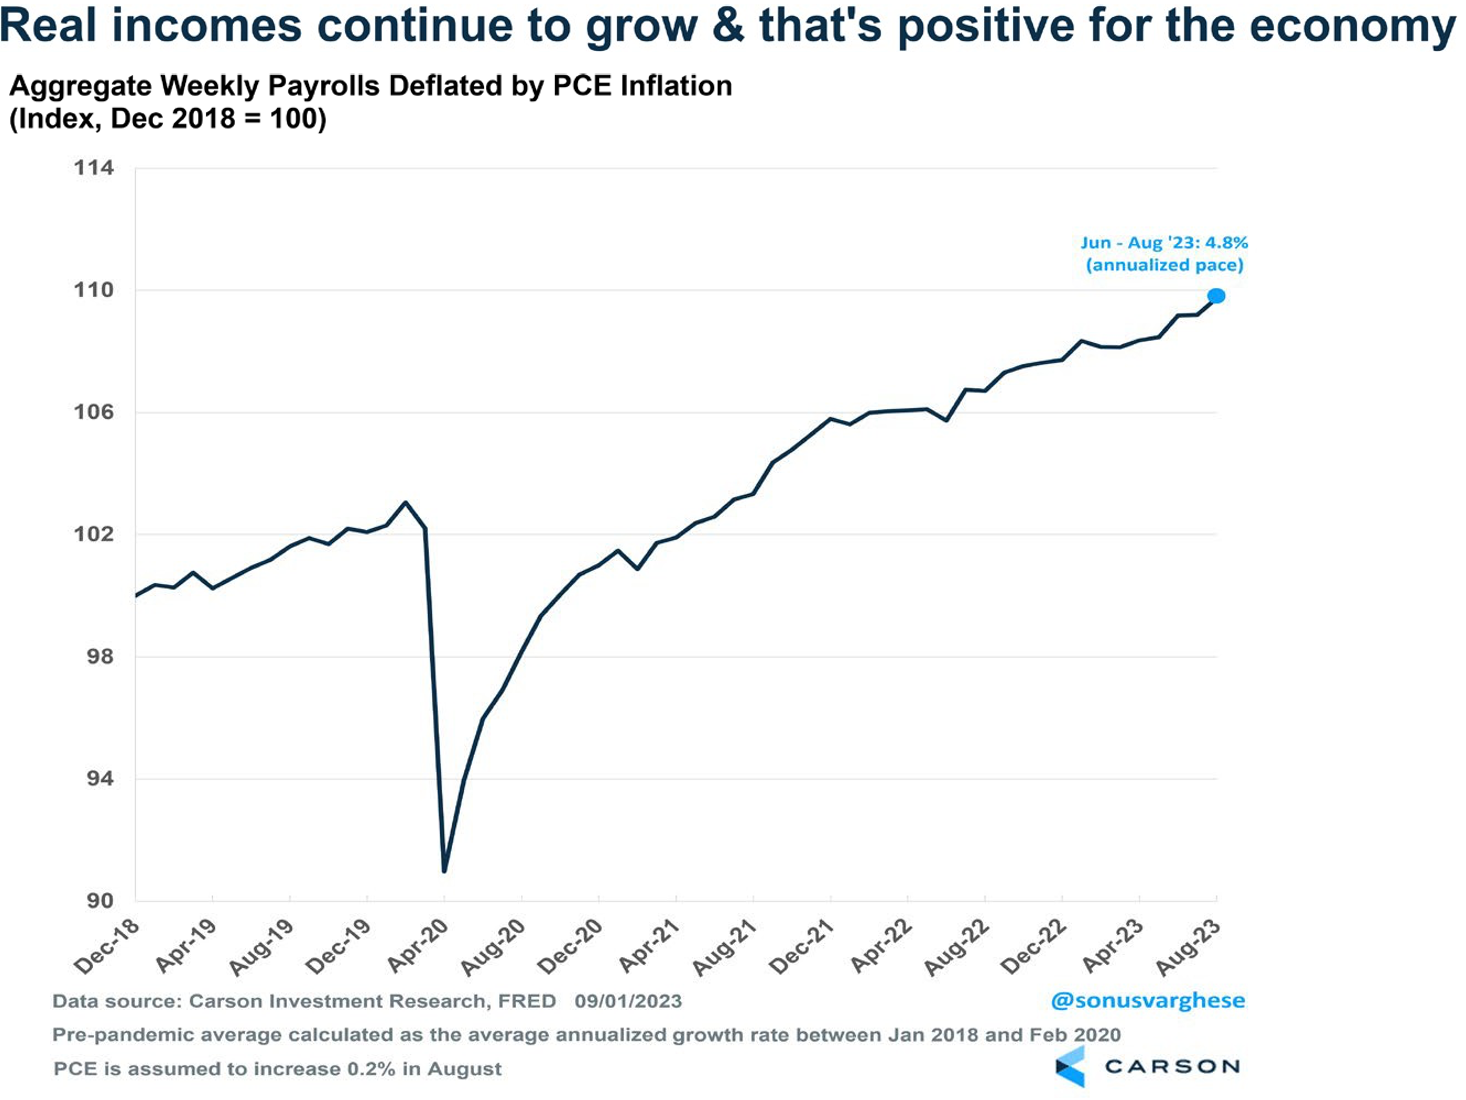
All these factors are presently in play, and so overall income growth across the economy is strong, which in turn is powering consumption. In fact, weekly income growth has run at a 5.2% annual pace over the past three months. That is higher than the pace of inflation. The Federal Reserve’s favored measure of inflation, which is based on the personal consumption expenditures index, has run at an annual pace of 3.3% over the last three months.
The economy created 336,000 jobs in September, blowing past expectations for a 187,000 increase. A large part of the growth was government jobs (+73,000), but even the private sector created 263,000 jobs. Not only that, payroll growth in July and August was revised higher by 119,000. So, over the last three months, payroll growth has averaged 266,000 per month. That compares to an average of 201,000 in the second quarter.
In short, the economy has strong momentum going into the fourth quarter, even in the face of various concerns that we’ve previously discussed (strikes, student loan payment restart, government shutdown). The unemployment rate was steady at 3.8%, but that’s well below historical levels.
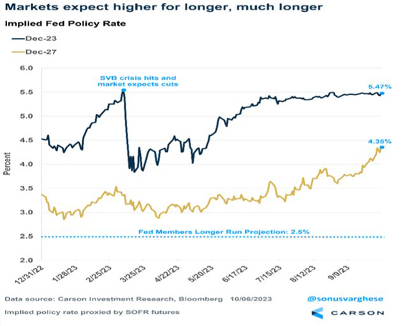
Investors have pushed bond yields much higher over the last three months. The 10-year Treasury yield is now above 4.80, compared to 3.80 at the end of June.
What’s interesting is that short-term interest rates haven’t budged. The market doesn’t think the Fed will raise rates again, which is why the implied policy rate expectation for 2023 has remained steady at 5.5%. Instead, as the chart above shows, the expected policy rate in 2027 has surged, from about 3% in May to 4.35% today. That’s a massive move, and it has happened because investors expect the Fed to keep rates higher well into the future.
Why have long-term rate expectations risen? The simplest answer is that investors think the economy is likely to strengthen. The surge in yields has come as economic data has shown signs of a much stronger and more resilient economy over the last three months. Investors are projecting that into the future. But that is also likely to keep inflationary pressures higher, which means the Fed must keep rates high to counter inflation.
In short, a stronger economy is pushing long-term yields higher, and that’s scaring investors into thinking that higher borrowing rates will persist, which could push the economy into a recession. That fear has created volatility in equity markets. If that doesn’t make sense to you, don’t worry, it shouldn’t.
We think good news for the economy is good news for the markets. Ultimately, profits come from economic growth, and that will eventually play out — perhaps sooner rather than later, as earnings season kicks off in a couple of weeks.
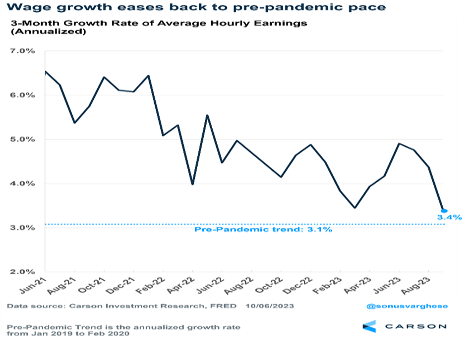
Wage growth, as measured by average weekly earnings, has now eased back to the pre-pandemic pace. Over the last three months, wage growth has run at a 3.4% annual pace, only slightly higher than it was prior to the pandemic.
While this level of wage growth is still strong, it does indicate that the labor market and the economy are not overheating. That’s important for Fed members as it eases concerns about a hot labor market pushing inflation higher. In fact, the proof is in the data. The economy has created 3.2 million jobs over the last year. Meanwhile, core PCE inflation, has slowed to 2.2% over the last three months (through August).
Markets at a Glance
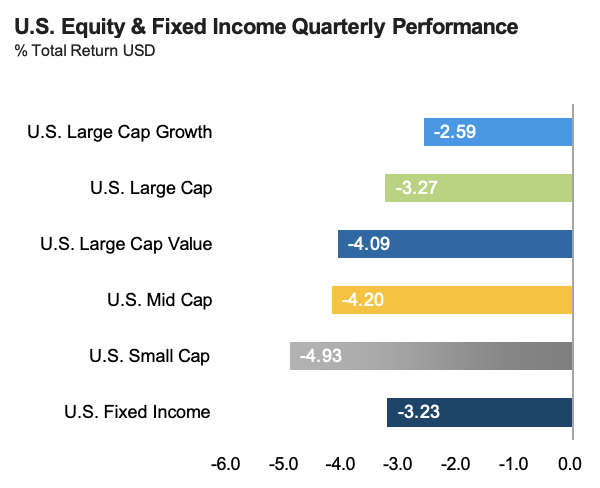
U.S. Equities: The S&P 500, representing large cap equities, returned – 3.3% in the trailing quarter and 21.6% in the past 12 months. Large cap growth outperformed value for the trailing quarter but underperformed for the year, returning -2.6% versus -4.1%, and 19.8% versus 21.6%. Nine of the eleven S&P 500 sectors finished with a negative return for the quarter. Energy was the best performing sector with a 12.3% gain while Utilities was the worst with a -9.3% return. Small caps returned -4.9% in the last three months and 10.1% in the past year.
International Equities: The MSCI EAFE benchmark returned – 4.1% in the trailing quarter and 25.7% for the past twelve months. The MSCI Emerging Index market equities returned -2.9% in the last three months and 11.7% for the trailing year. Emerging markets have continued to be challenged with supply chain issues and high inflation, which have been exacerbated by the Russia-Ukraine conflict.
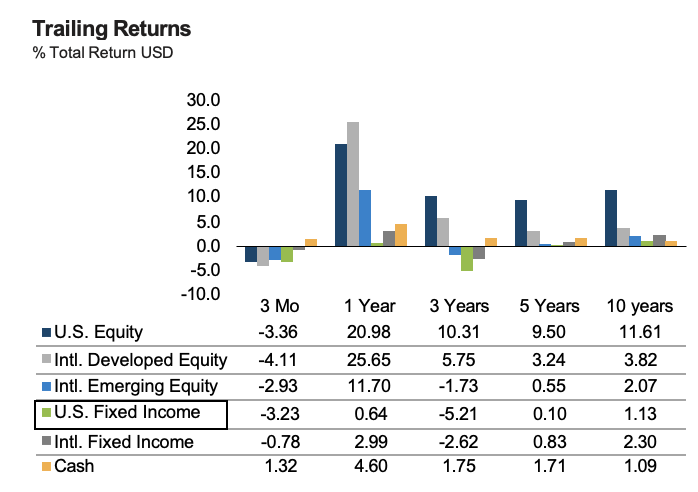
Fixed Income: The Bloomberg US Aggregate Bond Index returned – 3.2% in the third quarter and 0.6% for the past 12 months. The yield on the 10-year treasury bond rose to 4.59% by quarter end versus 3.81% at the end of the second quarter and up from the 3.83% a year ago. The ICE BofA High Yield Index returned 0.5% in the trailing quarter and 10.2% for the past year.
Economic Conditions During Geopolitical Turmoil
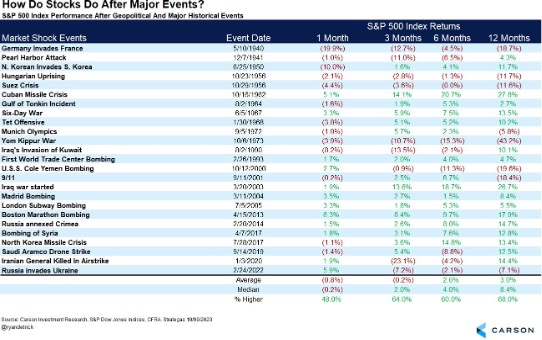
So far, the market’s reaction to the events in Israel has been somewhat benign compared to historical geopolitical shocks. Markets are a forward-looking mechanism and typically will look ahead to the economy recovering from the initial shock even as some uncertainty persists.
Looking at a list of similar historical events, median performance over the next year is somewhat lower than historical returns. The average return is also weaker than the median return, signaling some asymmetrical downside risk. But context here is very important.
Keep in mind that much of the negative market behavior is likely not driven by the geopolitical event itself. For example, the U.S.S. Cole bombing was coincident with the tech bubble bursting in 2000. What stands out from the chart is not so much the downside risk of geopolitical events, but the coincidence of drawdowns and recessions independent of geopolitical risks. If you look at the major drawdowns, most take place during or near a recession, including 1956, 1973, and 2000-2001.
There are cases where geopolitical risk played some role in the decline, such as the Yom Kippur War in 1973, but we believe the current circumstances are
quite different. In October 1973, an Arab coalition led by Egypt and Syria launched a surprise attack against Israel. After detecting Soviet resupply to Syria and Egypt, the U.S. began a massive resupply of Israel. The oil cartel OPEC responded by declaring an oil embargo against the U.S. and other countries. In 1973, the U.S. had grown increasingly dependent on foreign oil. As a result of the embargo, oil prices tripled and the added strain on the economy was one of the causes of the recession.
With the current events going in Israel, two risks do remain:
- There is, of course, the possibility for the conflict to expand and the Middle East remains a sensitive We view this as unlikely but still uncertain at the margin.
- The largest economic vulnerability for now is similar to the Ukraine Central banks, businesses, and consumers remain sensitive to inflation risk even as disinflation continues to be the primary path that prices have been following. As a result, broader sensitivity to higher oil prices may be more acute than usual.
MSCI EAFE – Designed to measure the equity market performance of developed markets (Europe, Australia, Asia, Far East) excluding the U.S. and Canada. The Index is market- capitalization weighted.
MSCI Emerging Markets – Designed to measure equity market performance in global emerging markets. It is a float-adjusted market capitalization index.
Bloomberg U.S. Aggregate Bond – The Bloomberg US Agg Total Return Value Unhedged, also known as “Bloomberg U.S. Aggregate Bond Index” formerly known as the “Barclays Capital U.S. Aggregate Bond Index”, and prior to that, “Lehman Aggregate Bond Index,” is a broad-based flagship benchmark that measures the investment grade, US dollar-denominated, fixed-rate taxable bond market. The index includes Treasuries, government-related and corporate securities, MBS (agency fixed-rate passthroughs),ÚBS and CMBS (agency and non-agency).
S&P 500 – A capitalization-weighted index of 500 stocks designed to measure performance of the broad domestic economy through changes in the aggregate market value of 500 stocks representing all major industries.
Investors cannot invest directly in indices. The performance of any index is not indicative of the performance of any investment and does not take into account the effects of inflation and the fees and expenses associated with investing.
Additional risks are associated with international investing, such as currency fluctuations, political and economic stability, and differences in accounting standards.
Due to volatility within the markets mentioned, opinions are subject to change without notice. Information is based on sources believed to be reliable; however, their accuracy or completeness cannot be guaranteed. Past performance does not guarantee future results.
